Works
Portfolio Single
Portfolio
Chocolate Sales Data
Vibrant Chocolate Sales Performance Analysis (January-August)
This analysis covers the sales performance of Vibrant Chocolate across six key markets (Australia, Canada, UK, India, USA, New Zealand) utilizing a dedicated team of 25 sales professionals selling a consistent product line. The primary goal is to assess performance over an eight-month period (January–August) by calculating Monthly total revenue, Marginal profit per product, Shipping volume (amount and boxes shipped) and statistics by country and Individual sales metrics to identify and reward the top salesperson.
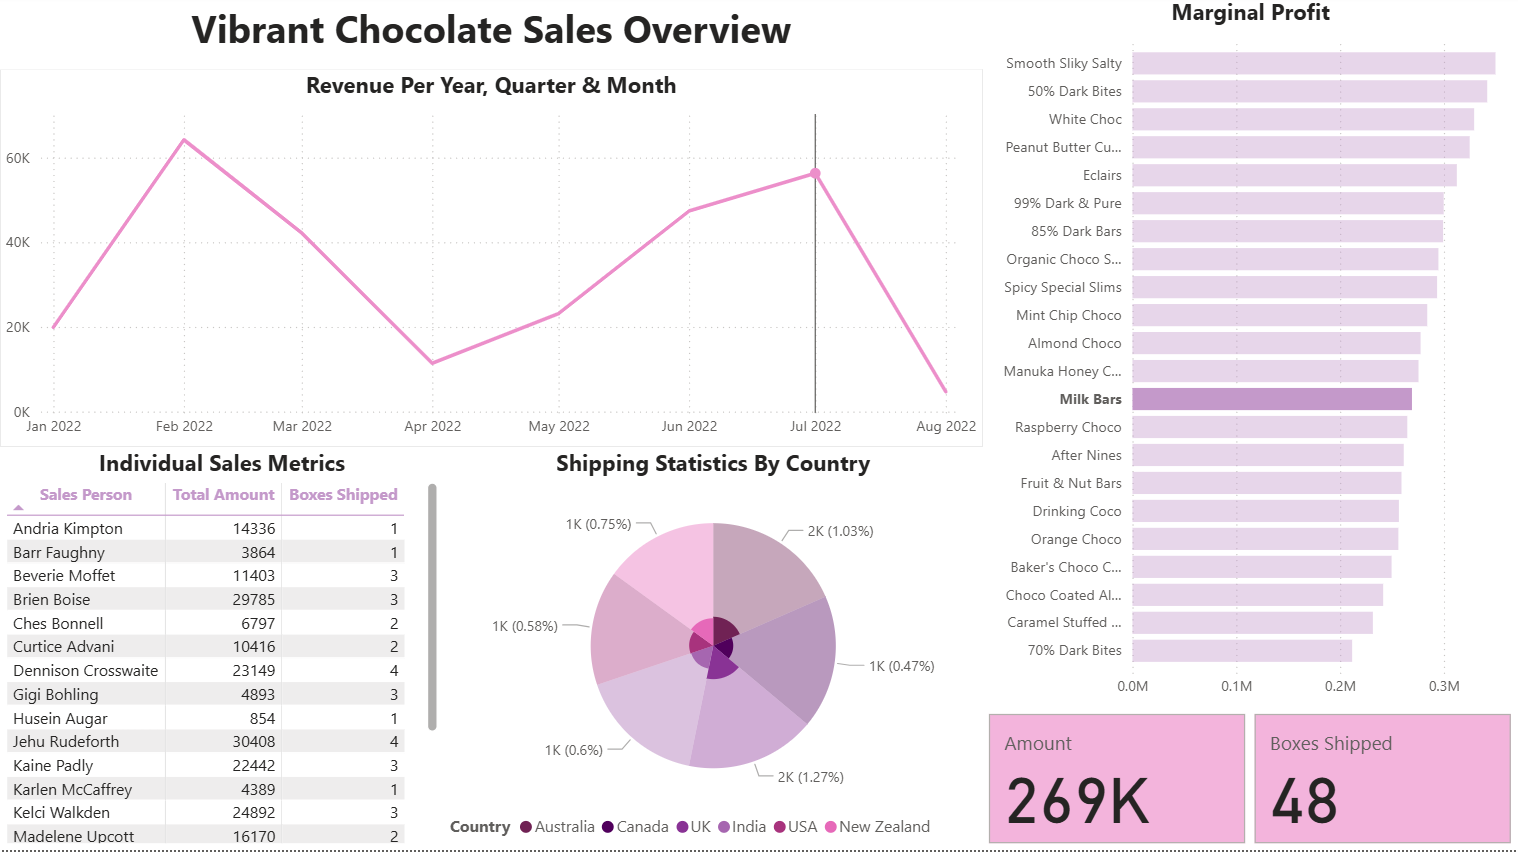
This dataset provides insight into product popularity across all six countries, allowing for the identification of top-selling items overall and by individual salesperson, as well as the calculation of total revenue and boxes shipped per country. It will also clearly depict the least profitable month between January and August.